
You are watching the dashboard. The numbers are moving. But do they mean your Large Language Model is actually learning, or is it just memorizing noise? If you have ever trained a neural network for natural language processing, you know that staring at a single number isn't enough to tell the whole story. You need to understand the relationship between two critical metrics: cross-entropy loss and perplexity.
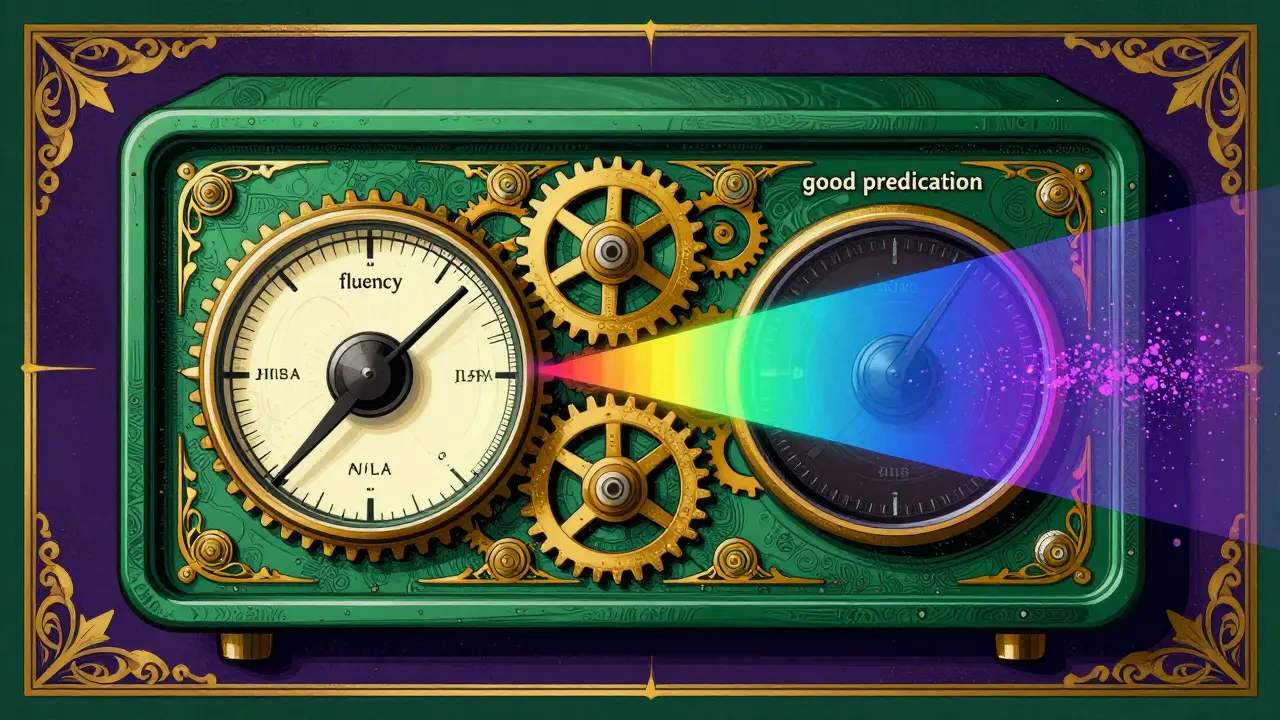
Think of training an LLM like tuning a radio. The static represents uncertainty. Your goal is to reduce that static until the signal comes through clear. In technical terms, you want the model to predict the next word in a sequence with high confidence. When you monitor these signals correctly, you can catch overfitting before it ruins weeks of compute time. When you ignore them, you end up with a model that sounds fluent but says nothing of value.
The Math Behind the Magic: Loss vs. Perplexity
To read the signals, you first need to speak the language. At its core, training a language model involves minimizing error. That error is measured by cross-entropy loss. This metric calculates how far off the model's predicted probability distribution is from the actual target distribution. It is the raw optimization objective. When you use libraries like PyTorch, this loss is typically calculated using natural logarithms, resulting in values measured in 'nats' (natural units).
But here is the problem with raw loss: it is abstract. A loss of 3.5 doesn't immediately tell you if your model is good or bad. Enter Perplexity. Perplexity is simply the exponential transformation of that loss. Mathematically, if your cross-entropy loss is $L$, then perplexity ($PPL$) is $e^L$.
Why does this matter? Because perplexity translates abstract math into intuitive intuition. A perplexity score tells you the effective branching factor of the model. If your model has a perplexity of 20 on a specific dataset, it behaves as if it is choosing randomly among 20 equally likely options for every token. Lower perplexity means less surprise. Less surprise means better prediction. As noted in recent analyses by Galileo AI (2024), this interpretability makes perplexity superior to raw loss for human monitoring during long training runs.
| Feature | Cross-Entropy Loss | Perplexity |
|---|---|---|
| Mathematical Form | Negative Log-Likelihood | $e^{Loss}$ (Exponential) |
| Unit | Nats or Bits | Dimensionless (Effective Vocabulary Size) |
| Interpretability | Low (Abstract) | High (Intuitive) |
| Primary Use | Optimization Objective | Evaluation & Monitoring |
| Ideal Value | As low as possible (>0) | As low as possible (>1) |
Reading the Training Curve: What Good Looks Like
When you start training, both your training loss and validation perplexity should drop rapidly. This is the "learning phase." The model is discovering basic grammar, syntax, and common phrases. However, the real insights come when the curve flattens.
A healthy training run shows a steady decrease in validation perplexity that parallels the training loss. If your training loss drops to near zero but your validation perplexity stops improving-or worse, starts rising-you have hit a wall. This is the classic signature of overfitting. The model is memorizing the training data rather than generalizing patterns. It knows the answers to the questions it has seen, but it fails to predict new text.
Consider the benchmarks. State-of-the-art models like GPT-3 achieved perplexity scores around 20-25 on standard corpora like the Penn Treebank. Compare this to older n-gram models that often scored between 100 and 200. If you are training a small model today and seeing a perplexity of 50 on clean web text, you still have room to improve. But if you see 15, congratulations-you are beating many commercial baselines. Context is everything. A perplexity of 20 on Penn Treebank might look terrible on noisy social media data, where a score of 50 could be excellent.

The Trap of Low Perplexity
Here is where things get tricky. Many developers fall into the trap of thinking lower perplexity always equals a better model. It does not. Perplexity measures fluency and statistical likelihood, not truthfulness or reasoning ability.
A model can generate grammatically perfect, coherent-sounding nonsense. Research published in early 2024 highlighted that perplexity filters often select text that is syntactically correct but semantically shallow. You might have a model with a fantastic perplexity score that hallucinates facts confidently. This is why perplexity alone is insufficient for final evaluation. It is a diagnostic tool for the training process, not a measure of intelligence.
This limitation explains why industry leaders supplement perplexity with other metrics. While 92% of LLM research papers in 2024 used perplexity as a primary metric, adoption of complementary tools like ROUGE (for summarization) and BERTScore (for semantic similarity) has grown by 47% since 2022. You need perplexity to ensure the engine runs smoothly, but you need other metrics to ensure the car is driving in the right direction.
Practical Implementation: Monitoring Without Breaking the Bank
You don't need extra GPUs to monitor these metrics. Calculating perplexity requires only forward passes on held-out validation data, which can often be done on CPU resources or a single GPU while the main training continues on others. The computational overhead is minimal-typically less than 2% of total training cost according to AWS SageMaker benchmarks.
However, frequency matters. Evaluating after every batch is too slow. Evaluating once per epoch is too sparse. Most practitioners find a sweet spot by evaluating every 500 to 1,000 training steps. This gives you enough data points to spot sudden spikes or plateaus without stalling your pipeline.
Watch out for these common pitfalls:
- Data Leakage: If your validation perplexity is significantly lower than your training perplexity, check your data splits. You likely have duplicate samples in both sets. One developer reported catching a 15% leakage issue this way, saving days of wasted tuning.
- Tokenizer Mismatch: Perplexity values are not comparable across different tokenizers. A model evaluated with Byte-Pair Encoding (BPE) will yield different scores than one using SentencePiece. Always compare apples to apples.
- Sequence Length Normalization: Ensure you are calculating perplexity per token, not per sequence. Longer sequences naturally accumulate more loss. Normalizing by length ensures fair comparison.
Beyond Perplexity: The Future of Evaluation
The landscape is shifting. By late 2025 and into 2026, we are seeing a move toward hybrid evaluation frameworks. Tools like Google's Perplexity Explorer and Meta's upcoming Contextual Perplexity metric aim to address the semantic gaps left by traditional calculations. These new methods incorporate reasoning checks and context coherence, aiming to penalize fluent but false outputs.
For now, however, perplexity remains the king of training diagnostics. It is fast, cheap, and directly tied to the fundamental objective of language modeling. Use it to guide your learning rate schedules, detect overfitting, and validate data quality. Just remember: it tells you how well the model predicts, not whether what it predicts is true.
What is a good perplexity score for an LLM?
There is no universal "good" score because it depends heavily on the dataset and tokenizer. However, as a rule of thumb, state-of-the-art models achieve perplexity scores between 20 and 25 on standard benchmarks like the Penn Treebank. Scores below 15 indicate exceptional performance on clean data, while scores above 50 suggest the model is struggling to capture basic language patterns or the data is highly noisy.
Why is my validation perplexity higher than my training perplexity?
This is normal and expected. The model has seen the training data multiple times and can predict it with high accuracy. The validation data is unseen, so the model is genuinely predicting based on learned patterns. A small gap indicates good generalization. A large, widening gap indicates overfitting, where the model memorizes training data but fails to generalize.
Can I compare perplexity scores from different models?
Only if they were evaluated on the exact same dataset using the same tokenizer and sequence length settings. Different tokenizers split text differently, changing the number of tokens and thus the average log-likelihood. Comparing scores across different setups is statistically invalid.
How often should I calculate perplexity during training?
Evaluate every 500 to 1,000 training steps. This frequency provides enough granularity to detect sudden changes in learning dynamics (like a spike due to a bad batch) without adding significant computational overhead to your training pipeline.
Does low perplexity mean the model is truthful?
No. Perplexity measures fluency and statistical likelihood, not factual accuracy. A model can generate grammatically perfect, coherent-sounding hallucinations with very low perplexity. You must use additional evaluation metrics and human review to assess truthfulness and reasoning capabilities.