
It is May 2026. The novelty of generative AI has worn off. Executives are no longer asking if they should adopt the technology; they are demanding proof that it works. The era of "vibe-based" metrics-where success was defined by how cool a demo looked or how many users clicked a button-is over. Today, leaders face a stark reality: prove the return on investment (ROI), or lose the budget.
This shift marks the transition from AI experimentation to enterprise accountability. You cannot secure continued funding by showing usage charts alone. You need an Executive Dashboard designed specifically for measuring Generative AI ROI through financial and operational impact. These dashboards do more than display data; they tell a story of value creation, risk mitigation, and strategic advantage. If you are a C-suite leader, your job is not just to implement tools but to demonstrate exactly where AI has shifted your P&L this quarter.
The Three Tiers of AI Measurement
To build a dashboard that resonates with boards and CFOs, you must move beyond vanity metrics. A robust framework operates across three distinct tiers. Each tier answers a different question, moving from basic adoption to deep financial impact. Ignoring any one of these creates blind spots in your strategy.
Tier 1: Action Counts (Adoption)
This is the baseline. Before you can measure value, you must confirm usage. This tier answers: "Are people actually using our AI tools?" Key metrics here include daily active users, interactions per user, and feature utilization rates. However, tracking this daily and reporting it only to IT leadership is insufficient for executive decision-making. It tells you *that* something is happening, but not *why* it matters financially.
Tier 2: Workflow-Time Saved (Productivity)
Here, we connect usage to efficiency. This tier compares task completion times before and after AI adoption. According to research from Deloitte Global, functions like IT, operations, and marketing often see the earliest gains. Your dashboard should track time saved per task alongside quality metrics. Speed without accuracy is a liability. By monitoring session duration and identifying power users versus lagging teams, you can optimize training and rollout strategies.
Tier 3: Revenue Impact (Financial Value)
This is the holy grail. Tier 3 connects AI directly to business outcomes. Metrics include revenue per employee improvements, customer satisfaction score changes, deal closure rate enhancements, and cost reduction per process. Advanced organizations use predictive analytics here to forecast ROI based on early adoption patterns. This is the data that secures long-term investment.
| Tier | Primary Question | Key Metrics | Reporting Frequency | Audience |
|---|---|---|---|---|
| Tier 1: Action Counts | Are people using it? | Active Users, Interactions, Feature Usage | Daily/Weekly | IT Leadership, Dept Heads |
| Tier 2: Time Saved | Is it faster/better? | Task Duration, Quality Scores, Error Rates | Monthly | Executive Team |
| Tier 3: Revenue Impact | Does it make money/save costs? | Revenue Lift, Cost Reduction, Margin Improvement | Quarterly | C-Suite, Board |
What CFOs and Boards Actually Want to See
Financial leaders speak a specific language: dollars, margins, and risk. They do not care about "engagement." They care about efficiency and bottom-line impact. When designing your dashboard, frame your data to answer their core concerns.
CFOs typically require three core metrics:
- ROI Calculation: Total value generated versus total investment. For example, stating "AI delivered $8M productivity value on a $2M investment (4x ROI)" is far more powerful than saying "adoption is high."
- Productivity Improvement Percentage: Efficiency gains compared to a pre-AI baseline. This shows tangible labor savings.
- Cost Per Productive Outcome: How much it costs to achieve a specific result with AI assistance versus traditional methods.
Board members look slightly broader. They want to see strategic positioning. This includes competitive advantage quantification, capability development pace, and long-term value trajectory. Bhubalan Mani, Lead of Supply Chain Technology at GARMIN, suggests organizing KPIs into three categories: Value (risk-adjusted EBIT lift, revenue from AI-enabled products), Trust (incident rates, bias findings), and Adoption (core workflows rewired). This balanced approach ensures you are not just chasing speed but also maintaining governance.

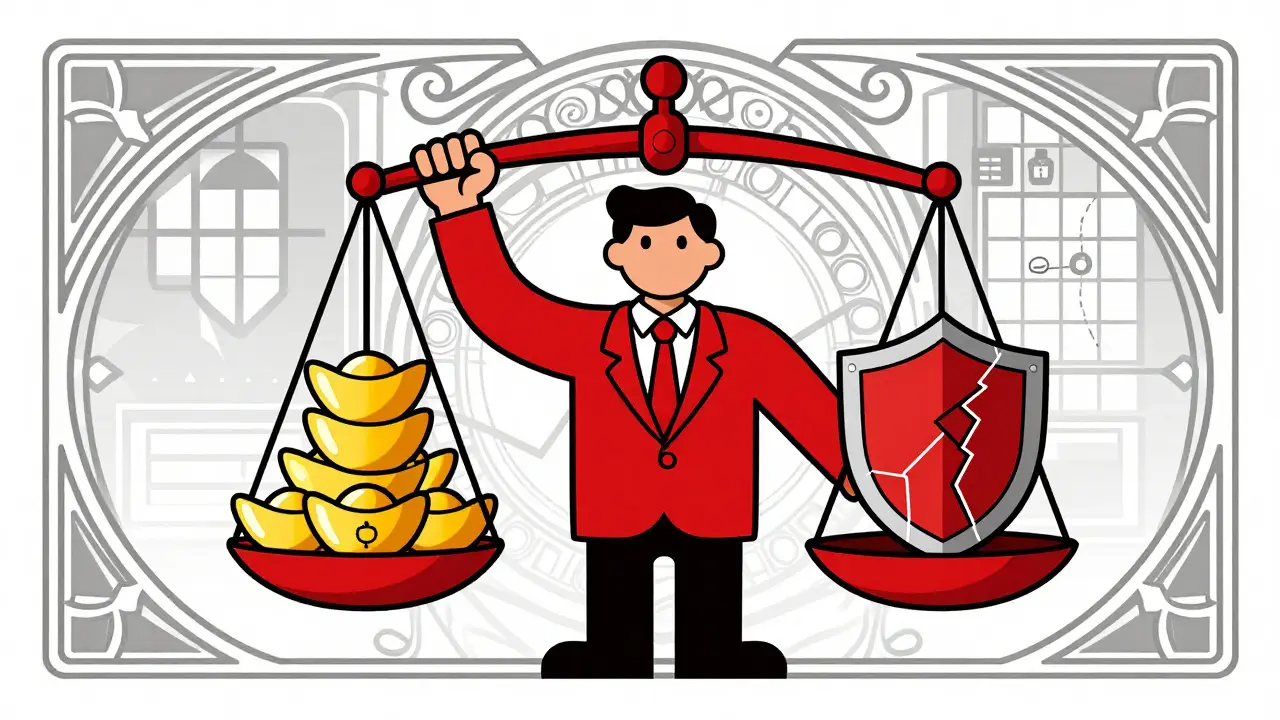
Balancing Value with Risk and Governance
In 2026, AI risk is a boardroom topic. A dashboard that shows massive productivity gains but ignores hallucination rates or data leakage incidents is dangerous. Sabarinath Yada from Accenture emphasizes a five-area framework: business impact, adoption, quality, human-AI collaboration, and risk/governance.
You must track trust metrics alongside financial ones. This includes:
- Incident Rates: Frequency of AI errors requiring human correction.
- Bias Indicators: Statistical measures of fairness in AI outputs.
- Regulatory Compliance: Adherence to evolving AI laws and standards.
Dileep Rai from Hachette Book Group notes that boards need to see durability. Is the AI solution stable? Does it reduce cycle-time in core processes without introducing new liabilities? Your dashboard should highlight these risks clearly, perhaps using red/yellow/green indicators, to show that growth is sustainable and safe.
Implementing Your Dashboard: A Phased Approach
Building a comprehensive ROI measurement system does not happen overnight. Attempting to launch all three tiers simultaneously often leads to data overload and inaccurate baselines. Instead, follow a structured 12-month rollout plan.
Phase 1: Foundation (Months 1-2)
Focus on Tier 1 metrics. Build the infrastructure to capture usage data. Secure baseline data for current workflow speeds. Identify pilot groups and establish clear definitions for "active use." This phase is about technical setup and initial adoption tracking.
Phase 2: Productivity Integration (Months 3-6)
Introduce Tier 2 metrics. Implement workflow time tracking tools. Establish quality measurement baselines. Begin correlating usage data with output volume. This phase requires closer collaboration between IT and department heads to define what "quality" looks like in each context.
Phase 3: Optimization & Financial Linkage (Months 7-12)
Launch Tier 3 metrics. Connect AI usage to financial systems (ERP, CRM). Achieve full ROI measurement capability. Use predictive analytics to forecast future value based on current trends. Scale successful approaches across the organization. This phase transforms your dashboard from a monitoring tool into a strategic asset.
Sector-Specific Adaptations
While the three-tier framework is universal, its application varies by industry. In manufacturing, for instance, executives are replacing manual reporting with generative AI dashboards that integrate ERP, MES (Manufacturing Execution System), and IoT data sources. Here, ROI might be measured in reduced downtime, predictive maintenance savings, or supply chain optimization.
In software development, metrics might focus on code generation speed, bug detection rates, and deployment frequency. In customer service, the focus shifts to first-contact resolution rates and average handle time. Tailor your Tier 2 and Tier 3 metrics to reflect the unique value drivers of your specific vertical. Generic dashboards fail because they do not speak to the specific pain points of your business model.
Tools and Technologies Enabling Visibility
The barrier to entry for creating sophisticated dashboards has lowered significantly. Tools like Figma’s AI executive dashboard generator allow teams to transform prompts into interactive data views, reducing the need for deep coding expertise. Platforms like Qlik provide centralized KPI displays that enable agile decision-making.
However, the tool is secondary to the strategy. A beautiful dashboard filled with irrelevant metrics is worse than no dashboard at all. Ensure your chosen platform supports real-time data integration, customizable alerts, and easy export capabilities for board presentations. The goal is democratization of insight, allowing leaders at all levels to access the data they need without waiting for IT reports.
How do I calculate Generative AI ROI accurately?
Calculate ROI by comparing the total value generated (time saved converted to monetary value, revenue uplift, cost reductions) against the total investment (software licenses, implementation costs, training, maintenance). Formula: (Net Profit / Cost of Investment) x 100. Ensure you establish a clear baseline of performance before AI implementation to measure true incremental gain.
What are the most important KPIs for AI dashboards?
The most critical KPIs fall into three tiers: Adoption (daily active users, interaction rates), Productivity (time saved per task, quality scores), and Financial Impact (revenue per employee, cost reduction, margin improvement). Focus heavily on Tier 3 metrics for executive communication as they directly tie to business value.
Why is risk management included in AI ROI dashboards?
Risk management is crucial because unchecked AI can lead to reputational damage, regulatory fines, and operational errors. Including metrics like incident rates, bias indicators, and compliance status ensures that productivity gains are not achieved at the expense of trust or legal standing. Boards require assurance that AI initiatives are durable and safe.
How often should AI ROI metrics be reviewed?
Review frequencies vary by metric type. Adoption metrics should be tracked daily or weekly for operational adjustments. Productivity metrics should be reviewed monthly to identify trends. Financial impact and strategic ROI metrics should be analyzed quarterly for board reporting and long-term planning.
Can small businesses benefit from AI ROI dashboards?
Yes, even small businesses need to justify AI spending. While they may not have complex multi-tier dashboards, tracking basic metrics like time saved per hour and cost per outcome provides essential visibility. Simple spreadsheets or lightweight BI tools can suffice initially, focusing on direct cost savings and efficiency gains.